UnrealInsights
Profiling Reactional Footprint in Runtime
To use the Profiler you can start realtime stats or use Unreal Insights.
CMDs
Stat
| Stat | Output |
|---|---|
| stat Reactional 1 | Enable runtime stat view in Editor |
| stat Reactional 0 | Disable runtime stat view in Editor |
Insights
| Trace Reactional Channel | Output |
|---|---|
| Trace.Start ReactionalChannel | Start Recording Trace |
| Trace.Start ReactionalChannel | Stop Recording Trace |
| Build Development | Output |
|---|---|
| Trace.File ExampleFolder/ReactionalChannel | Start Recording Trace to Path |
| Trace.File localhost_ReactionalChannel | Start Recording Trace on Your Machine |
| Trace.File 192.158.1.38_ReactionalChannel | Start Recording Trace on Custom IP Adress |
Profiling
 To view Profiler you can use the Editor windo or the commands above to set
 Channels, Diplay Profiler or Show Stats.
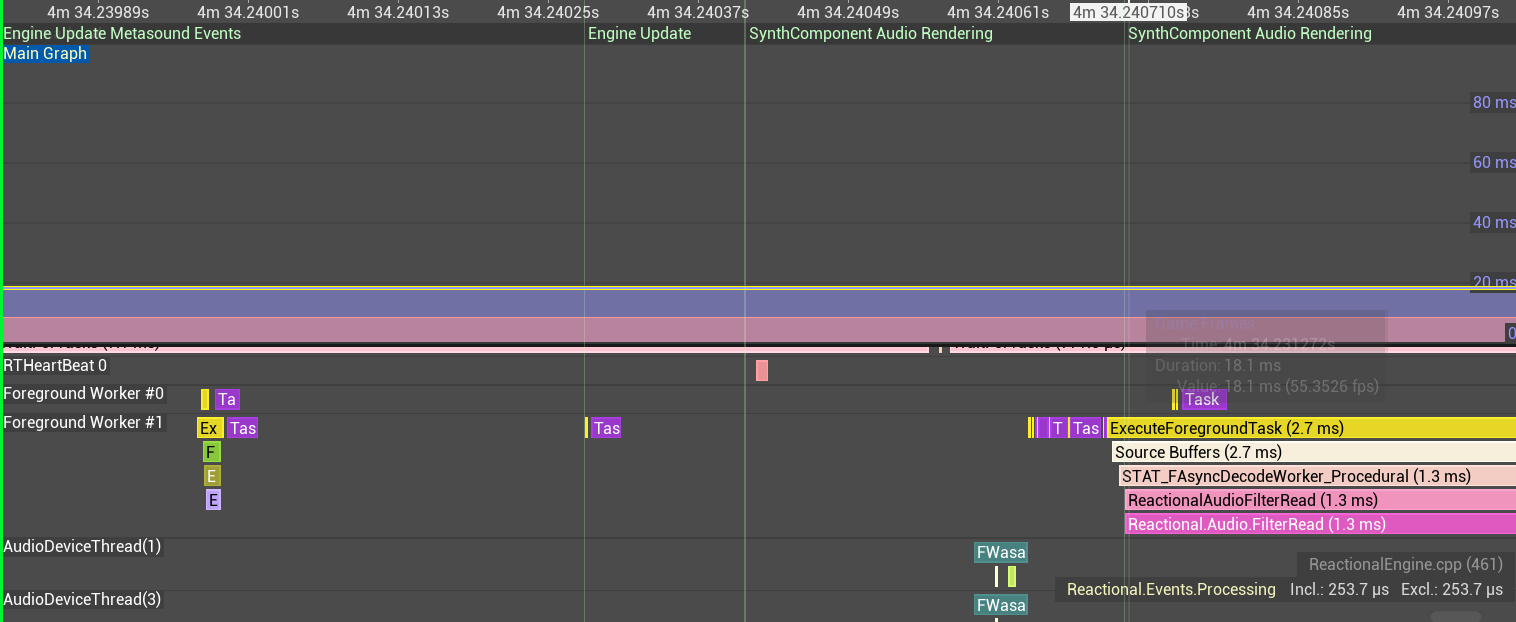
Now you will see the Footprint in Runtime that is Used by Reactional Engine.
These are the Profilers added so you can check the Trace -> UnrealInsights after you started a trace
| Profilers | Category | Name |
|---|---|---|
| Reactional.Engine.Update | Engine | Update |
| Reactional.Audio.FilterRead | Audio | FilterRead |
| Reactional.Events.Processing | Events | Processing |
Flags
Inside Unreal Insights you will also see our custom Flags

Timer View
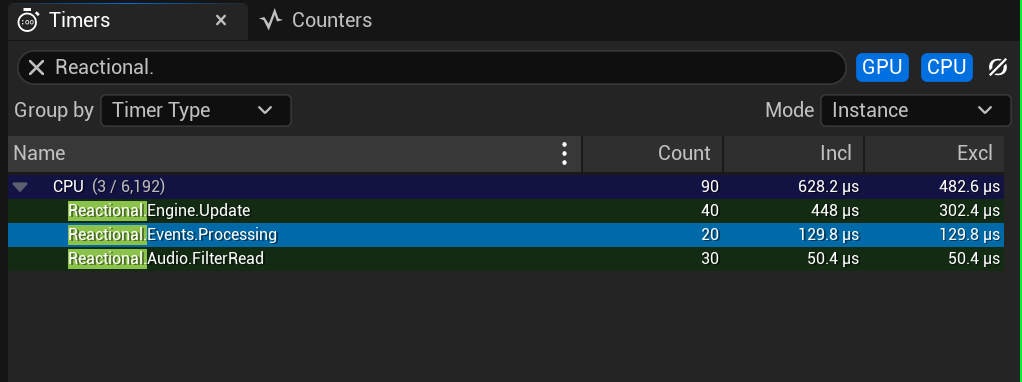
And when clicking in the Insights timeline you can search for profilers.
It would look something like this when you search for Reactional.Category.Name.
