ProfilerController
Profiling Reactional Footprint in Runtime
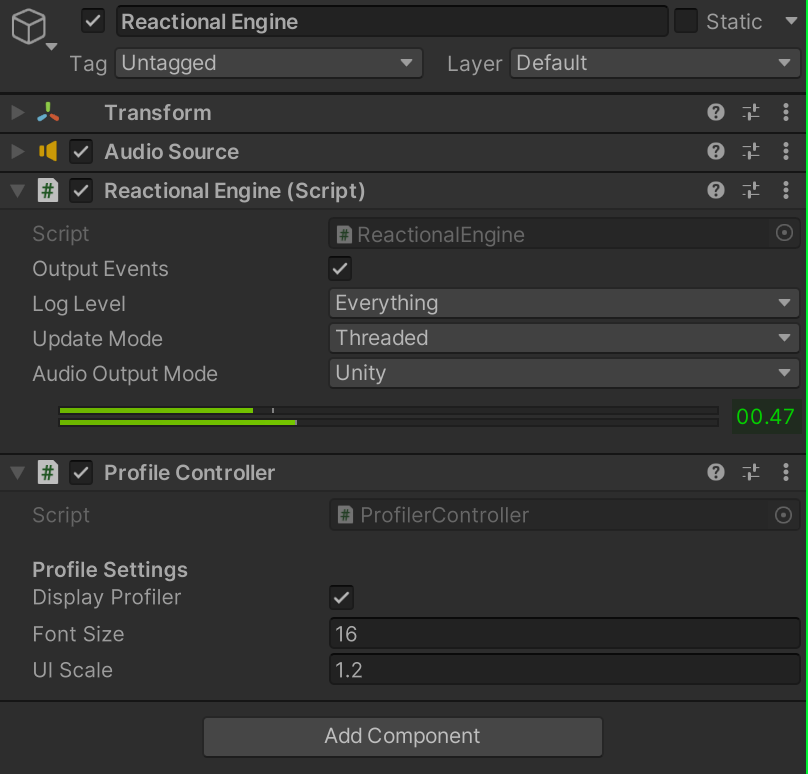
To use the Profiler simply click on the Reactional Manager Object and select the child Reactional Engine.
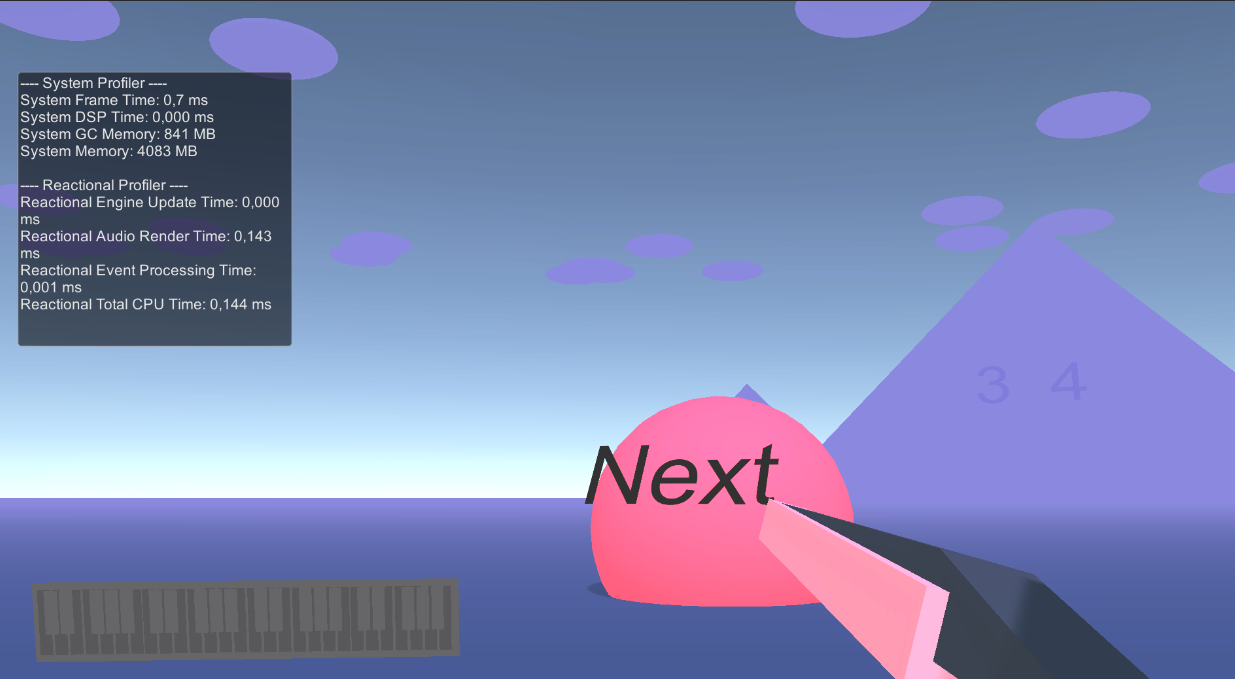
Here you will see the Profiler Controler. Set the Diplay Profiler to True under Profiler Settings.

Now you will see the Footprint in Runtime that is Used by Reactional Engine.

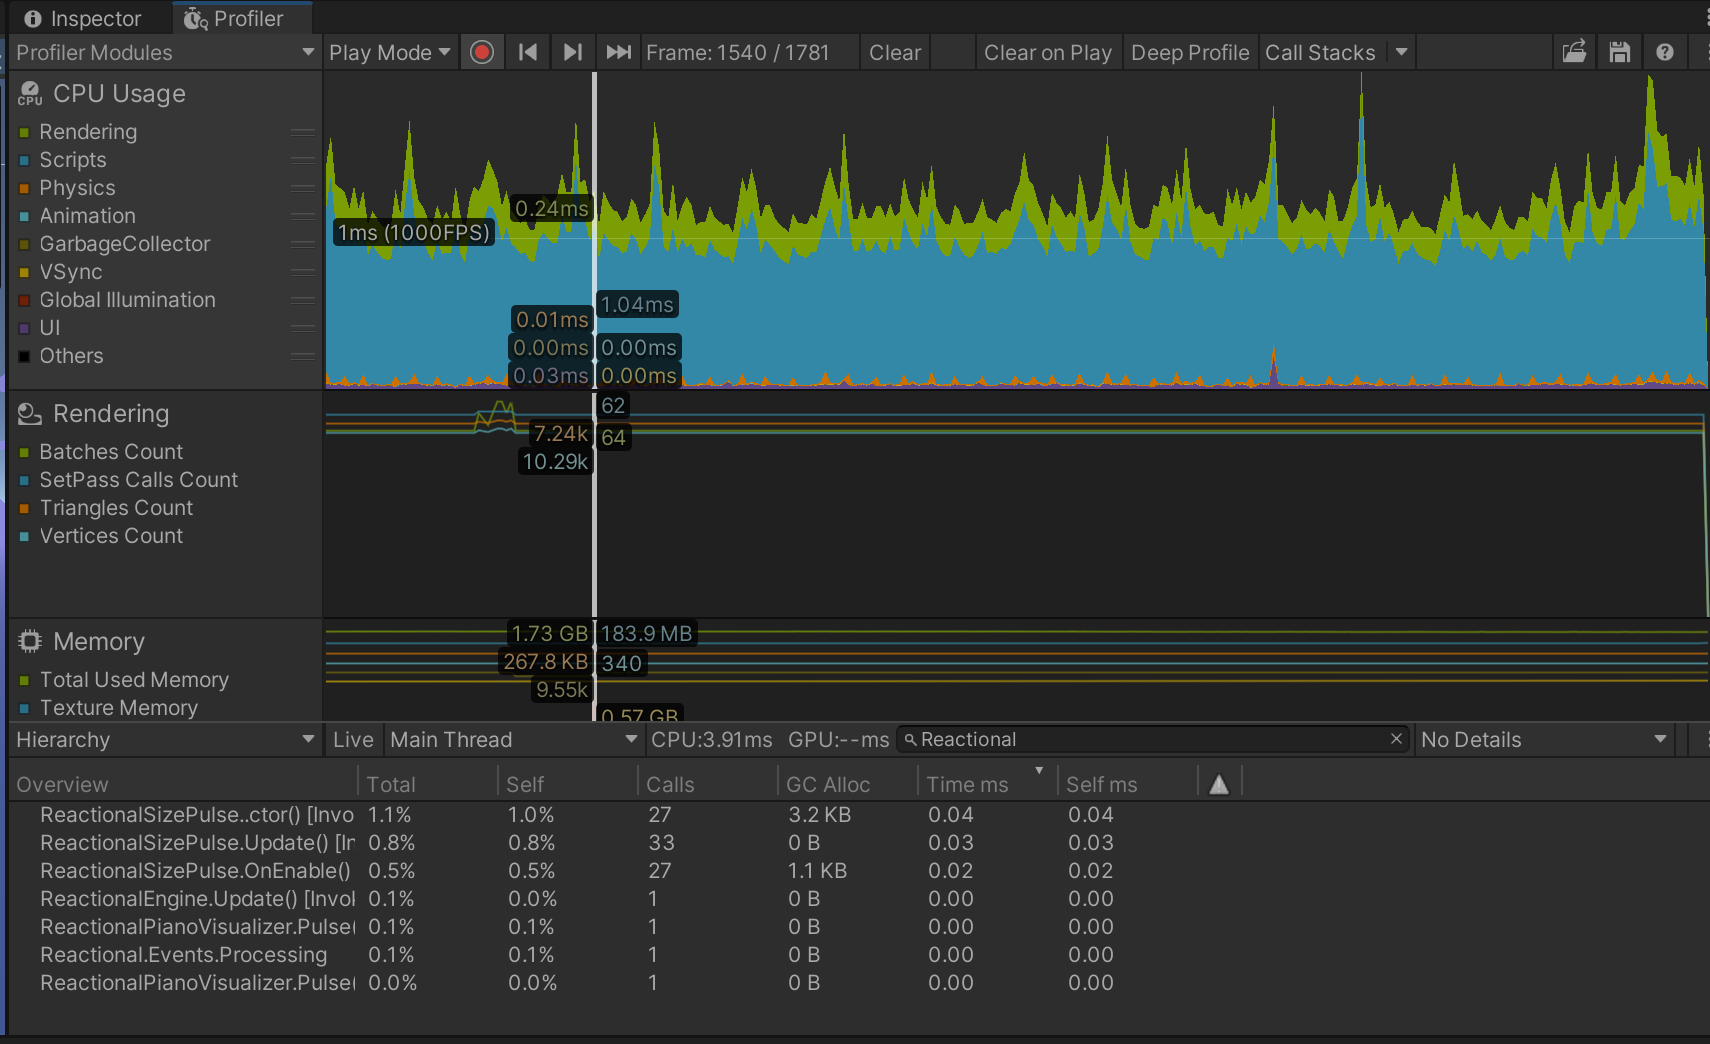
Theres also Profiler Markers added so you can check the Unity Analysis -> Profiler
| Profiler Marker | Category | Name |
|---|---|---|
| Reactional.Engine.Update | Engine | Update |
| Reactional.Audio.FilterRead | Audio | FilterRead |
| Reactional.Memory.Management | Memory | Management |
| Reactional.Resource.Cleanup | Resource | Cleanup |
| Reactional.Events.Processing | Events | Processing |
| Reactional.Manager.UpdateBundles | Manager | UpdateBundles |
| Reactional.Bundle.Parsing | Bundle | Parsing |
It would look something like this when you search for Reactional.Category.Name.
